Introduction
This series will consist of several parts written over several weeks and will encompass the planning, sizing, implementation, and monitoring of vSphere Flash Read Cache to improve Data Warehouse performance using locally attached SSDs.
- Part 1 – Introduction and Sizing
- Part 2 – Implementation
- Part 3 – Monitoring / Tweaking
- Part 4 – Conclusion
While going through the new features we gained by moving from vSphere 5.0 to vSphere 5.5 we decided to see how vSphere Flash Read Cache could help our Data Warehouse jobs’ run times.
As part of this discovery process we needed to take a look and see if vSphere Flash Read Cache (hereafter as vFRC) would be a good candidate for our Data Warehouse.
Facts about the target system:
- RedHat Enterprise Linux 5.8
- Oracle Enterprise Edition 11gR2 (11.2)
- Approximately 1.1TB of data
- Not using ASM
Some quick analysis on the database revealed that 90.2% of database disk actions were physical reads, making this a very promising candidate for a read caching solution. Because of budgetary concerns we decided to start small with some local SAS SSDs. Other, more expensive options include Flash PCIe cards that were incompatible with our blade servers.
Reading some best practice articles (below) it was decided that a lot of effort would have to go into determining the proper sizing of the cache allocated to the VM.
- vSphere Flash Read Cache Product Page
- Performance of vSphere Flash Read Cache in VMware vSphere 5.5 (Highly Recommend!)
- VMware vSphere Flash Read Cache 1.0 FAQ
Cache Sizing
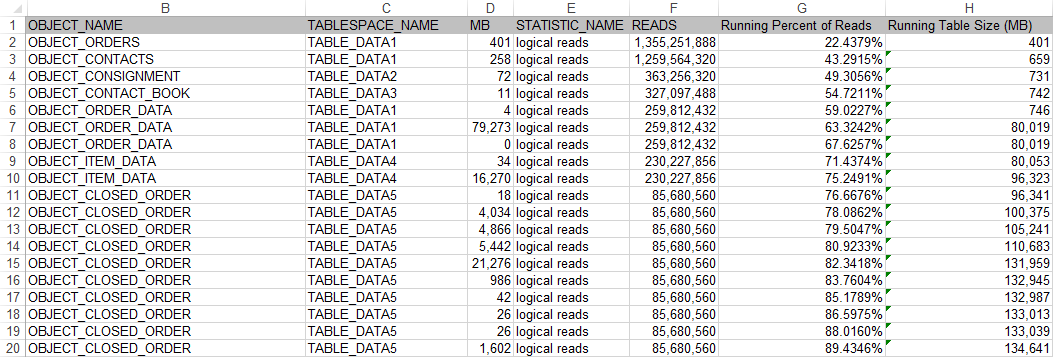
From the Oracle side we pulled some access data that allowed us to see table names, table sizes, and the number of reads from each table over a certain period of time.
Anonymized data is below:
…and so on for another 15,000 lines.
We found that in our Data Warehouse that 50% of all reads were satisfied by the same ~740MB of data. As you expand that percentage it grows very quickly. 80% of reads were satisfied by the same 110GB of data. This meant our DW, while being 1.1TB in size had a small amount of frequently accessed data and a large amount of seldomly accessed data.
Analyzing this data we determined a good starting point to be 150GB of data at around the 97.5% mark. This meant that we could store 97.5% of the most popular data in 150GB. The last 2.5% was the remaining 950GB and was most likely historical tables that are rarely accessed.
Cache Block Size Sizing
At this point we have a good starting point for a vFRC size, but now we need data on the proper block size to choose.
First, an excerpt from the vFRC Performance Study by VMware:
[…] Cache block size impacts vFRC performance. The best way to choose the best cache block size is to match it according to the I/O size of the workload. VscsiStats may be used to find the I/O size in real-time when running the workload. […]
vscsiStats is a command accessible from the ESX command line. From the command help:
VscsiStats — This tool controls vscsi data collection for virtual machine disk I/O workload characterization. Users can start and stop online data collection for particular VMs as well as print out online histogram data. Command traces can also be collected and printed.
In order to determine the best block size we will use vscsiStats to determine the spread of different I/O request sizes.
Start by listing available VMs and their disks with:
Virtual Machine worldGroupID: 1203178, Virtual Machine Display Name: USATEST01, Virtual Machine Config File: /vmfs/volumes/523358d4-466be286-1837-842b2b0ca19e/USATEST01/USATEST01.vmx, {
 Virtual SCSI Disk handleID: 8192 (scsi0:0)
}
Once you find the correct disk to monitor begin collecting statistics using the following format:
vscsiStats -s -w [worldGroupID] -i [handleID]
Example:
vscsiStats: Starting Vscsi stats collection for worldGroup 1203178, handleID 8192 (scsi0:0)
Success.
As the statistics are collected you can query the ioLength histogram using the following command:
vscsiStats -p ioLength -w [worldGroupID] -i [handleID]
In my example the output is as follows. This example VM is mostly idle.
[... SNIP ...]
Histogram: IO lengths of Read commands for virtual machine worldGroupID : 1203178, virtual disk handleID : 8192 (scsi0:0) {
 min : 512
 max : 1052672
 mean : 52740
 count : 33823
   {
      2627               (<=                512)
      562                (<=               1024)
      960                (<=               2048)
      758                (<=               4095)
      7513               (<=               4096)
      950                (<=               8191)
      1098               (<=               8192)
      1707               (<=              16383)
      3633               (<=              16384)
      10227              (<=              32768)
      275                (<=              49152)
      1210               (<=              65535)
      375                (<=              65536)
      95                 (<=              81920)
      130                (<=             131072)
      485                (<=             262144)
      293                (<=             524288)
      925                (>              524288)
   }
}
[... SNIP ...]
While this command gives output for read, write, and combined SCSI commands, we don’t really care about the last two. Since vFRC only caches reads we really only care about how big the reads are that are being satisfied by the SCSI disk. In the case of the disk above that the most popular READ block size was 32K at 10227 of 33823 reads (~30%). On our Data Warehouse we ended up with the following table:
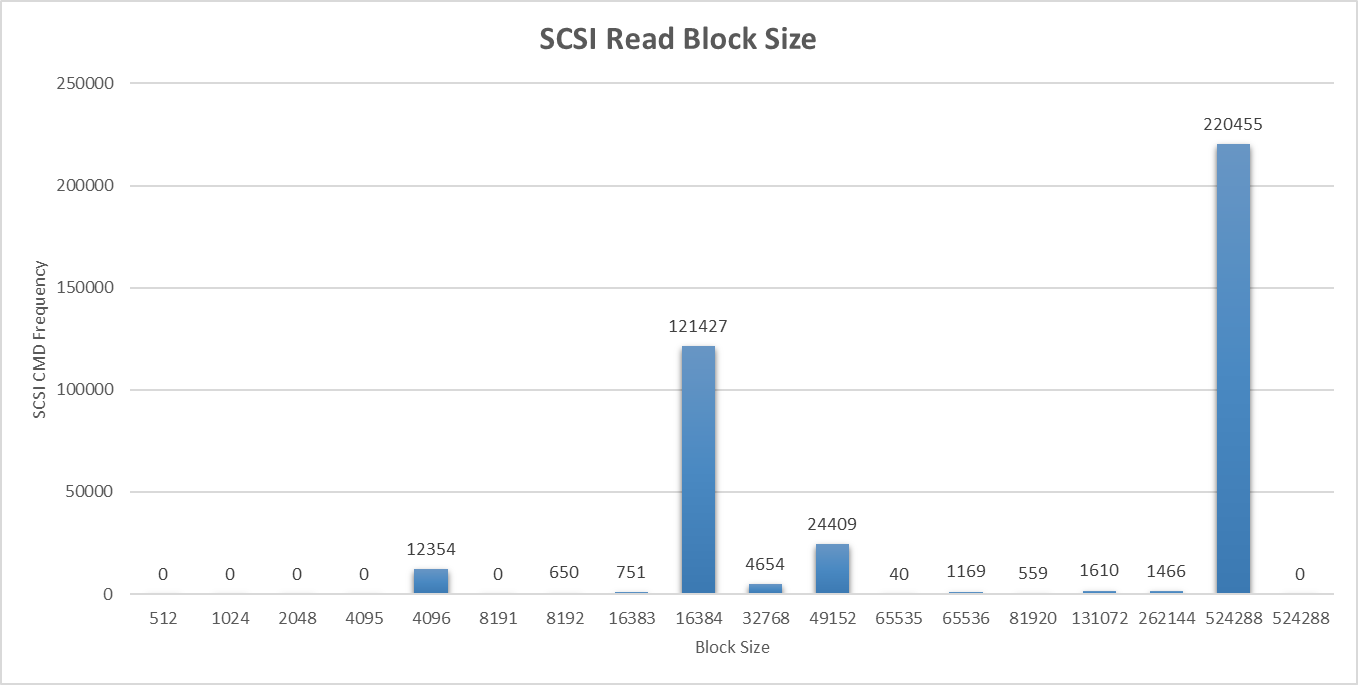
Since they were split between 16K blocks at 31% and 512K blocks at 57% we opted for 512K block sizes.
In addition the total count of read commands was 389,544 over this period of time, while write commands totaled 32,843. Running the math shows us that we;re pretty close to our 90% mark from the database.
![]()
Conclusion
In this part we’ve accomplished the following:
- Identified a need for faster performance on our Data Warehouse.
- Used Oracle’s reporting tools to determine that we need approximately 150GB of cache in order to satisfy the large majority of the reads of the system.
- Used VMware’s vscsiStats command to determine that the most used block sizes were 16K and 512K
- Combined these conclusions to determine a good initial configuration of 150GB cache with a 512K block sizes.
Additional Reading:
- (From Introduction) vSphere Flash Read Cache Product Page
- (From Introduction) Performance of vSphere Flash Read Cache in VMware vSphere 5.5 (Highly Recommend!)
- (From Introduction) VMware vSphere Flash Read Cache 1.0 FAQ
- Using vscsiStats for Storage Performance Analysis
- Getting started with vscsiStats
In Part 2 we’ll cover the following:
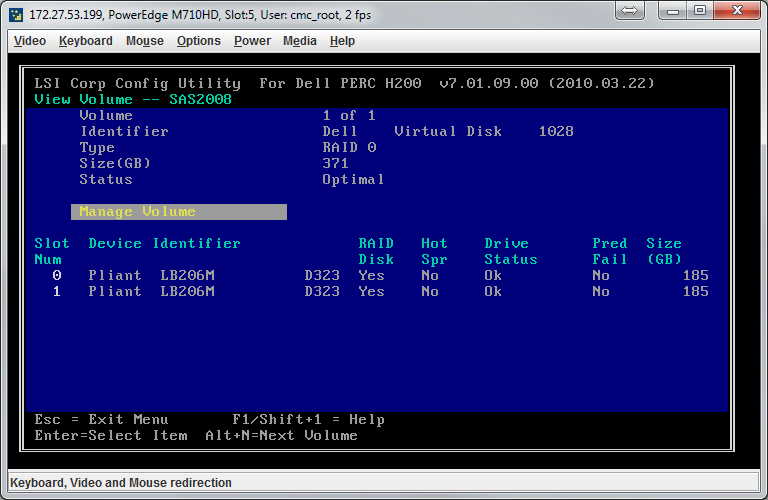
- Install two Enterprise SSDs in each of two ESX hosts
- Configure each Dell ESX host’s SAS controller to treat the SSDs as a single RAID0 set
- Configure the ESX host to treat the newly found drive as an SSD
- Make the SSD available as a Virtual Flash Resource
- Configure our Data Warehouse’s data drive to have the configuration we reasoned out in Part 1.
Great article, really helped me get my head around this topic.
so thanks
but actually could not get a clear answer :
this is my output :
Histogram: IO lengths of commands for virtual machine worldGroupID : 2193013, virtual disk handleID : 8275 (scsi0:0) {
min : 512
max : 49152
mean : 6174
count : 41373
{
84 (<= 512)
166 (<= 1024)
40 (<= 2048)
21 (<= 4095)
27231 (<= 4096)
25 (<= 8191)
8551 (<= 8192)
3646 (<= 16383)
1184 (<= 16384)
423 (<= 32768)
2 (<= 49152)
0 (<= 65535)
0 (<= 65536)
0 (<= 81920)
0 (<= 131072)
0 (<= 262144)
0 ( 524288)
}
}
Histogram: IO lengths of Read commands for virtual machine worldGroupID : 2193013, virtual disk handleID : 8275 (scsi0:0) {
min : 9223372036854775807
max : -9223372036854775808
mean : 0
count : 0
{
0 (<= 512)
0 (<= 1024)
0 (<= 2048)
0 (<= 4095)
0 (<= 4096)
0 (<= 8191)
0 (<= 8192)
0 (<= 16383)
0 (<= 16384)
0 (<= 32768)
0 (<= 49152)
0 (<= 65535)
0 (<= 65536)
0 (<= 81920)
0 (<= 131072)
0 (<= 262144)
0 ( 524288)
}
}
Histogram: IO lengths of Write commands for virtual machine worldGroupID : 2193013, virtual disk handleID : 8275 (scsi0:0) {
min : 512
max : 49152
mean : 6174
count : 41373
{
84 (<= 512)
166 (<= 1024)
40 (<= 2048)
21 (<= 4095)
27231 (<= 4096)
25 (<= 8191)
8551 (<= 8192)
3646 (<= 16383)
1184 (<= 16384)
423 (<= 32768)
2 (<= 49152)
0 (<= 65535)
0 (<= 65536)
0 (<= 81920)
0 (<= 131072)
0 (<= 262144)
0 ( 524288)
}
}
Now how can define reservation and block size ?
Just a note that VFRC is discontinued in ESXi 7.
Here is a link on how our VirtuCache software compares with VFRC
https://virtunetsystems.com/vmware-vfrc-vflash-read-cache-competitor-virtunet-virtucache/
Thus far we (Virtunet Systems) are the only host side caching software that supports (1) caching reads and writes (2) all ESXi releases till ESXi 7 (3) VDI and server VMs
Disclosure – I am a SE for Virtunet