This part three of the series will focus on providing an overview how to drive the most value out of your monitoring environment. This should give you a head start during implementation so you can make the correct configuration choices the first time.
- Part 1 – Introduction and Requirements
- Part 2 – Industry Leaders and Selection
- Part 3 – Effective Monitoring
- Part 4 – Implementation and Discovery
- Part 5 – Dashboards, Reports, and Access
- Part 6 – Continuous Improvement
How do you effectively monitor an environment? This question by itself doesn’t really make sense; the point of monitoring is to take some action on that information. The question should really be “How can I leverage my monitoring solution to make my environment better?”.
Environment Improvement via Monitoring
In essence it usually comes down to the following:
- Quicker Time-To-Resolution – How quickly can you resolve a problem after it forms?
- Interruption Prevention – How can I prevent interruptions of service, or schedule them for a less disruptive time?
- Dashboards – How can I and others quickly assess the health of the environment? (Part 5)
- Reporting – How can I gather information across my environment to better make future decisions? (Part 5)
Most monitoring solutions collect more data than you will ever access. This is not wasteful, it helps ensure that you have all the information at your fingertips when you need to answer a question. In my experience people can sometimes fall into the trap of “We have all this amazing data, lets alert on all of it.” That is bad and will lead to the monitoring system not being effectively valued. I suggest following the concept of gather lots, act on little.
Gather Lots, Act on Little
This concept is very simple: Your monitoring solution should ONLY reach out to you if there is an issue that you can take an action on.
Every time you create an alert, set a threshold, or make any change that could generate more alerts, ask yourself: “If I get this alert, what action am I going to take?” That doesn’t mean right this second, but each notification you get should translate into an item on your “To Do” list.
Consider the following notifications that you could configure via the various products listed in Part 2:
- System goes offline.
- Are you REALLY going to investigate why this system went offline? Probably, keep it around.
- System disk usage reaches 90%.
- Are you REALLY going to investigate that disk and see what is consuming space? Probably, keep it around.
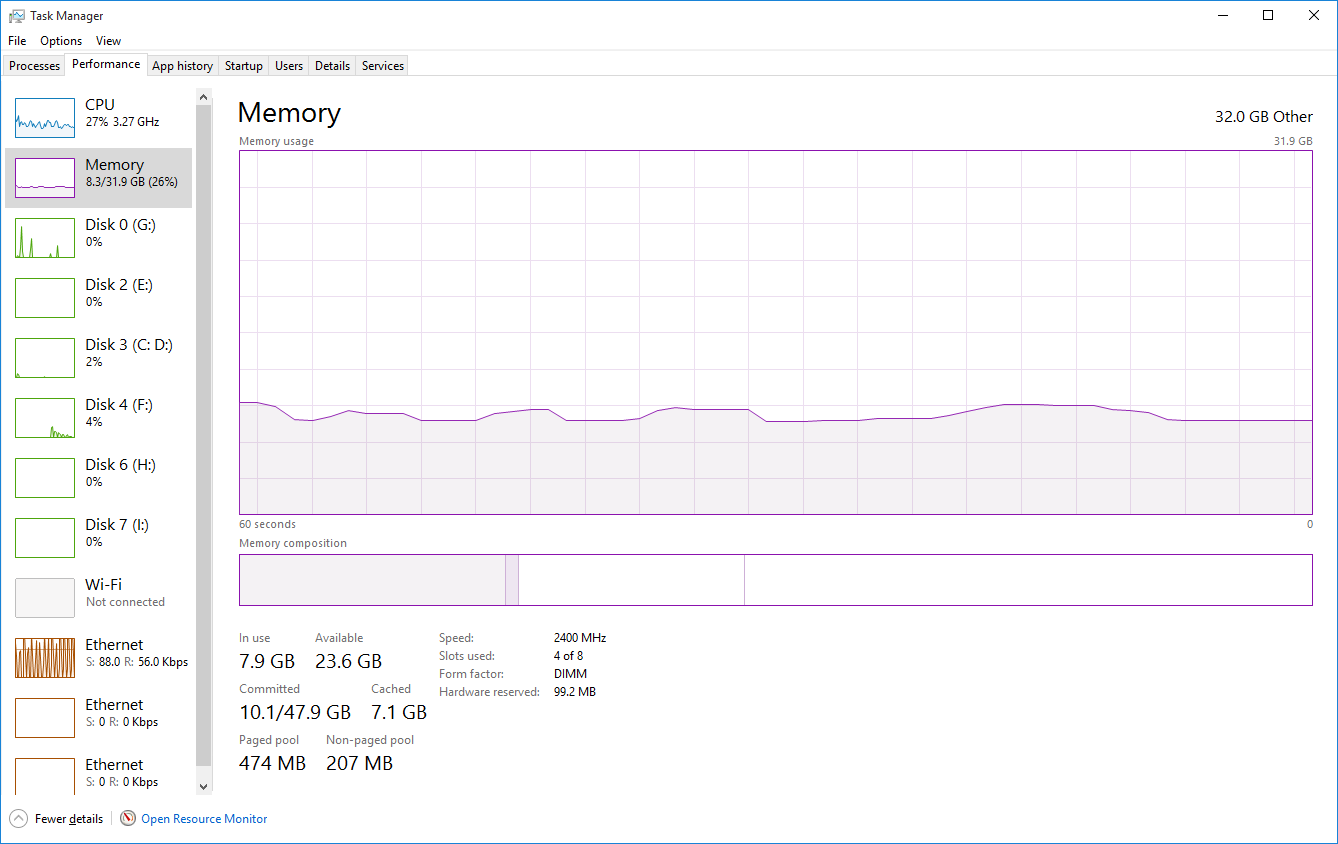
- System memory usage reaches 90%.
- Are you REALLY going to log in and see what processes are consuming the memory? Probably not, consider being very picky about when to enable this.
- System CPU usage reaches 90%.
- Are you REALLY going to log in and see what processes are consuming the CPU resources? Probably not, consider being very picky about when to enable this.
- Server Network Traffic reaches 90% of the link speed.
- Do you have any way to determine what caused this? Is this even worth investigating as it was likely an infrequent-burst?
Monitoring systems gather a lot, and that’s great when you need a lot of information. The downside of alerting on too much is the monitoring tool will earn a reputation for being too spammy. If you’re not going to take actions on CPU spikes, they’re just going to get automatically deleted. Your users are going to start associating emails from the tool with “this doesn’t apply to me” and they will begin to be ignored.
Quicker Time-To-Resolution (TTR)
If your monitoring solution only sends alerts that have actionable outcomes, this immediately removes the guesswork of “Do I really need to fix this?” Chances are, yes, you need to fix it. It’s not quite that simple but there is functionality inside the monitoring system you can leverage to quickly resolve issues:
- Send alerts directly to the people who can fix the problem. Maybe this is a ticket queue or a list of emails.
- For important servers, consider after-hours alerting where low-criticality issues go to email, and high-criticality issues go directly to a text message.
- If your monitoring solution supports escalations, consider implementing them to keep awareness of the issue fresh in everyone’s mind.
- Use the historical trending in your tool to quickly determine if this is an on-going growth issue, or if this is a one-off that will resolve itself.
- For example, Drive C hit 95%. It’s been steadily growing over the past year, it’s probably Windows Update creep and we can’t resolve, let’s add 10GB of disk space.
- For example, Drive D hit 95%. It’s had slow growth over the past year, except last week it started growing much faster. Consider talking to the application owner to see what may have caused the acceleration in growth. Maybe he forgot to turn off verbose logging and you don’t have to expand the disk. Maybe he enabled new functionality and the disk will need to be grown frequently.
Interruption Prevention / Early Warning
Once the environment is fairly stable, after you’ve fixed all the initial problems the newly implemented monitoring solution uncovered, you can being to be proactive. Many types of utilization alerts function as early warning indicators.
Generally a 90% threshold on a disk doesn’t indicate a problem NOW, but it means there will likely be a problem once another 10% disk usage is consumed. You can take that information and work with the application owner to expand the disk live, expand the disk tonight after hours, take an extended outage this weekend, etc.
Without any indicator, usually the disk would fill up, the application would in some way have deteriorated functionality, triggering a user to contact someone who can help fix it. That conversation will end up with you having the exact same conversation with the application owner, except with less options for resolution since the system is down. This process takes time and costs businesses money.
Being pro-active with the environment quite literally gives man-hours back to your organization. Your 10-minute analysis and response of resizing a disk before it is an issue, saves hours of frustration, troubleshooting, and meetings on the back end.
Conclusion
At this point you should have a good idea what you’ll want to alert on, and how you can effectively convert those alerts into value for your organization.
In this part we accomplished the following:
- Discussed the core concepts of how monitoring makes the environment better
- Explored the concert of “Gather Lots, Act on Little”
- Understood how effective monitoring directly leads to less downtime and a quicker Time-To-Resolution
- Learned how to leverage the monitoring system to solve issues before they’re problems.
In Part 4 we’ll cover the following:
- Implementation methodology
- Basic setup requirements for most monitoring systems.
- Discovery of systems and services.
This is series is great, thanks! When can we expect parts 4+??